Search This Blog

Saturday, January 16, 2016

A Taylor buy day in the 30 yr Bond Futures

There has been a lot of volatility this past week, so I thought that I would show an example of a classic Taylor buy day in the 30 year bond futures. A TTT buy day follows a shorting day, taking out the low of the short day, then reversing into a trending up day.

It is important to pay attention to the short term trend, and try and trade in its direction. In this case the slow line of the 3-10 oscillator is above zero, and is of positive slope- both indicating a short term uptrend. Price is also above the 20 day ema, the only moving average that I use. Note the daily chart below-


Please also note below, the 15 minute chart of those two days. Several things are going on here-

1. The Jan 11 low of 155-11 is taken out around 3:45 am.

2. Although price reverses above that level at 6:00 am, that was too early for me. We got a second chance at 7:30. This bar was also a short term trendline break.

3. There is a 15 min divergence- price is sloping down, but the fast line of the 3-10 makes a higher low.

Price continued to move up all day, hitting the Dec 11 high of 157-17, a nice point to have a profit taking stop in place. Price moved up a little more after that, but if you cannot watch the market all day, you have to consider profit targets.


Saturday, August 8, 2015

Divergences

It sure has been along time since my last post. I really lost interest in posting for a while, but think that it would be worthwhile to continue to post and record my experiences in trading. I have been working a bit on my trading psychology, but I'll get into that more in future posts.

Today, I want to post a little about divergences. One of Linda Raschke's trading patterns is a 10 day divergence, referencing price levels against the highs and lows of the 3-10 oscillator. She discusses this more in her presentation of 5 Trading Patterns, and it has become the only indicator that I use. I also use a moving average- a 20 bar EMA, but that's all. Linda's trade is based on a 10 day divergence- 10 days from price low to price low. Sometimes it is 9, or maybe 11-12 days, but pretty much around 10 days. This is also a very similar to her turtle soup pattern, written about in Street Smarts.

Trader Vic Sperandeo discusses what he refers to as a 2b pattern, this is not always 10 days- it can be less or greater, and does not use an oscillator. Read more in "Trader Vic" for this pattern. It is good for picking up short term trend direction changes, and is a pattern that I will be using more.

Refer to the below chart of November soybeans, and look at the arrows on both the price chart, and 3-10 oscillator.


You will see that for the 1st, 2nd, and 4th set of prices, the price bars make new lows, but the blue line of the oscillator (sometimes referred to as the fast line) makes higher lows. Hence, the divergence. For the 3rd set of prices, the price bars make new highs, but the fast line is making a lower low.

Sometimes there is a small reward, and sometimes big. It will be interesting to see where this most recent trade goes, as Friday's price bar is hitting the 20 day EMA.

Saturday, September 8, 2012

Trading Breakouts

I wanted to post a bit on trading breakouts. In particular, I want to provide my thoughts on what happens the day after a breakout. Keep in mind that I am writing in reference to the Taylor Trading Technique, and Linda Raschke's writings (especially Street Smarts). According to Raschke, in an appendix of my copy of The Taylor Trading Technique by Trader's Press, she says that Taylor says to skip the first buy day, when price is breaking down from a congestion area. I am also looking at this when price is breaking up, as well. I have not yet found this in Taylor's writing, but let's assume that he did state this.

In one of her articles, Raschke mentions that she skips the first buy or sell swing at the start of a trend, often caused by- an NR7 bar (usually preceding a breakout), 3 small range days (consolidation), the point of a wedge (also consolidation), a breakaway gap, or a rising ADX. The point here is that a move out of congestion or consolidation is often the start of a new trend, or a continuation of a trend, with the consolidation portion being a pause in the trend. This can be seen on a bar by bar basis, as often after a strong breakout bar, there is a consolidation bar, many times a narrow range day, or chop that forms a doji bar. On an intra-day chart, this shows as consolidation.

Below are some charts that show this, starting with Friday's E mini future.


A consolidation can be clearly seen as a descending triangle, with support at the 20 day ema. Friday showed a big breakout, closing at the highs of the day. I got tricked into looking for a SS day after the breakout, but neglected to view things within the larger context of the uptrend, and fact that the b/o day was likely the resumption of that trend out of consolidation.

For a couple of more examples, see the below chart of Crude oil-


Notice the first congestion area. looking like a small box. The breakout bar clears the 20 day ema, possibly signaling the upturn of trend. the bar following tests the ma, but regains it- not a good SS day, but rather, a pause before the next up bar. The price trend then consolidates into a descending triangle at the ema, then moves out of it on high volume. the bar after the b/o bar is a z day, you would not be wise to short it.

Here is a recent example of Copper-


The first breakout moves out of a small triangle that is within a larger pattern. The upper trend line serves as good point for setting a profit target. Note that price broke out following a narrow range doji bar, then formed another consolidation bar just below the upper trend line (just like the bar preceding the first b/o). This first move is part of a First Cross pattern that Raschke writes about often. It is often the second wave of a three wave a-b-c trend move.

Friday brought another breakout, due to the China announcement of more easing. Thursday's day after the b/o could have been traded as a SS day, but the lesson here is to trade the post b/o days carefully, especially if they seem to be indicating a change of trend.

Finally, take a look at the multiple breakouts in this chart of gold futures. See the small and larger triangle breakouts, and note that the b/o bar has increased volume compared to the day before. The third b/o is from a small bull flag, a consolidation pattern. The last b/o is very interesting. Thursday, price broke out of a pattern of three small range days (mentioned above), but closed weakly. It did close above Tuesday's high, and the sell off Friday morning may have well sucked in a lot of shorts before reversing. The lesson is to be careful shorting right after a breakout from consolidation.


Use this tendency to stay safe, and perhaps use as a criteria for holding onto a b/o bar for more than just the one day. All of that said, there does seem to be good reason to short after a breakout, when the trend is NOT changing, but I will post regarding that, at another time.

Sunday, July 1, 2012

A classic TTT sell short trade

I wanted to show you what a more typical sell short day looks like. Earlier, I discussed short selling a buy day high made first, but below is a classical Taylor sell short day. As you can see below on the daily chart of the October sugar futures, the sell day high was taken out on the sell short day, then price reversed.


Below is 15 minute chart, that shows the sell day high, the entry bar for the short sale breaking the sell day high and 20 bar ema, as well as a trend line break, which further confirms the trend change.


What you can also see, is the wide range sell off bar at 9:30 that is a great indication to cover the short, and take profits, when this many traders are selling, it's a great idea to cover the short position. As Linda Raschke said- "when the ducks quack, feed them!".

Saturday, June 30, 2012

When to be careful on a buy day

On Wednesday, I put on a buy day long position on the August gold futures (GC), and was stopped out of the trade. While this happens now and then, in retrospect, there was good reason to have been extra careful, or to have avoided the trade altogether. The chart below shows the set up day- a buy day, a sell day, followed by a sell short day. This should have set up a Taylor buy day, where the sell short day low is taken out, then a reversal takes place.


For a buy day entry, I look for three things to take place-

1. A break of the previous day's low.
2. Price reversal above that previous low.
3. A break of the 20 bar exponential moving average on a 15 minute chart.

See the chart below, and you will see the horizontal red line that shows the previous day's low, a consolidation of price, and the break above the low, which also broke the 20 bar ema. Following the breakout, price fell, and I was stopped out, as the lower trend line was taken out. 


Here is the daily chart that show how the day ended up- lots of chop back and forth, with no real directional movement-


So what is to be learned from this? I asked Scott Hoffman (my broker and a great Taylor Trading educator) what he thought, and why he noted the buy day of GC as "careful" in his Swing Trader Insight service (worth looking into if you want to trade the TTT method). His comment was that the setup day was an inside day, in addition to having been a shorting day. This indicates that a breakout may be coming, as it was not a true sell short day. A better trade would have been to go long if the previous day had been a proper sell short day.


Sunday, June 24, 2012

Selling short on a buy day

This past Friday, sugar futures presented a perfect example of a shorting opportunity on a Taylor buy day. The second chart below is the daily bar chart for the October contract for SB. Monday set up a breakout- a doji bar just below the 20 day ema. The breakout did occur on Tuesday, with Wednesday carrying further momentum, often a sell short day after a breakout.

On Thursday, we see a classic Taylor sell short day bar. The previous high was taken out, then price reversed through that high, giving a signal to short. You will see in the chart directly below, that the horizontal red line indicates the previous high, with it being taken out at 10:00 am. Price tested the morning high, then broke down again at 11:30 am (see the yellow arrow). I use the 20 bar ema on a 15 minute chart to help validate the trend reversal, so the 11:30 bar is my entry signal.


This shorting day sets up the Taylor buy day. The bias coming into Friday would be to look for a violation of the Thursday low, then a reversal into an uptrend for the day. Instead, price opened above the Thursday low, dipped a little, then climbed before falling. How can this be traded? I have found that the 50% fib retracement is a good indication of whether or a not a trend will continue, or fail. Other classic fib levels can be used, but even going back to Charles Dow, and then taught well in Victor Sperandeo's book Trader Vic, the 50% level is pretty reliable, and can be used an trend entry level if you are not able to catch a buy day or sell short day entry earlier. For more on this, follow Scott Hoffman's blog (click on his name under "trading links"), or go to Richard Russell's site, Dow Theory Letters.

As you will note in the below chart (15 minute bars), the 50% retracement principle comes into play clearly. I have drawn fib level lines, from Thursday's high (double top), down to the low just after the open on Friday. The high on Friday tested, then failed at, the 50% fib level (see the horizontal blue line). Again, I use the 20 bar ema on the chart as a trend reversal validation tool, so the short signal for me came at 9:00 am, with the wide range bar at 10:45 indicating that the position should be closed out. A bar like this is often a sign of an exhaustion move.


So, while the day after a sell short day of often a buy day, if the previous day's low is not taken out, but price climbs, this may be indicative of continued selling pressure, and a "buy day, high made first" setup may present itself as an opportunity to short.

Friday, February 3, 2012

Whipsawed in a trade

I want to provide an example of a trade that was a losing trade, even though all of the trader actions were correct. More importantly, we need to look at the mental states involved, and what could have happened. This morning, there was a breakout setup in soybean futures. Being able to be at the screens at the open (9:30 am CT), I went long as soon as price went above the last high (the overnight session), and had my stop in place. Price then reversed against my position. Here is where new traders can freeze, thinking that the trade will come back and go their way. If a b/o reverses, you have to get out.

Fortunately, I closed the long position, and went short. Experience has shown that a failed breakout can yield a good trade as price goes against the trapped longs. In this case, price reversed again, and went well above my short entry. At that point, I had no business being in the trade, and covered the short.


As you can see above, the 5 minute bar at the open created a crazy candle. The lesson here is- this stuff happens, and the key is that as long as you know that you trade a system that has a positive expectancy, you have to take all signals, both long and short. There will be losing trades now and then, but we are trading on probabilities, not absolutes.


Saturday, December 3, 2011

Trades for Monday 12/5/11

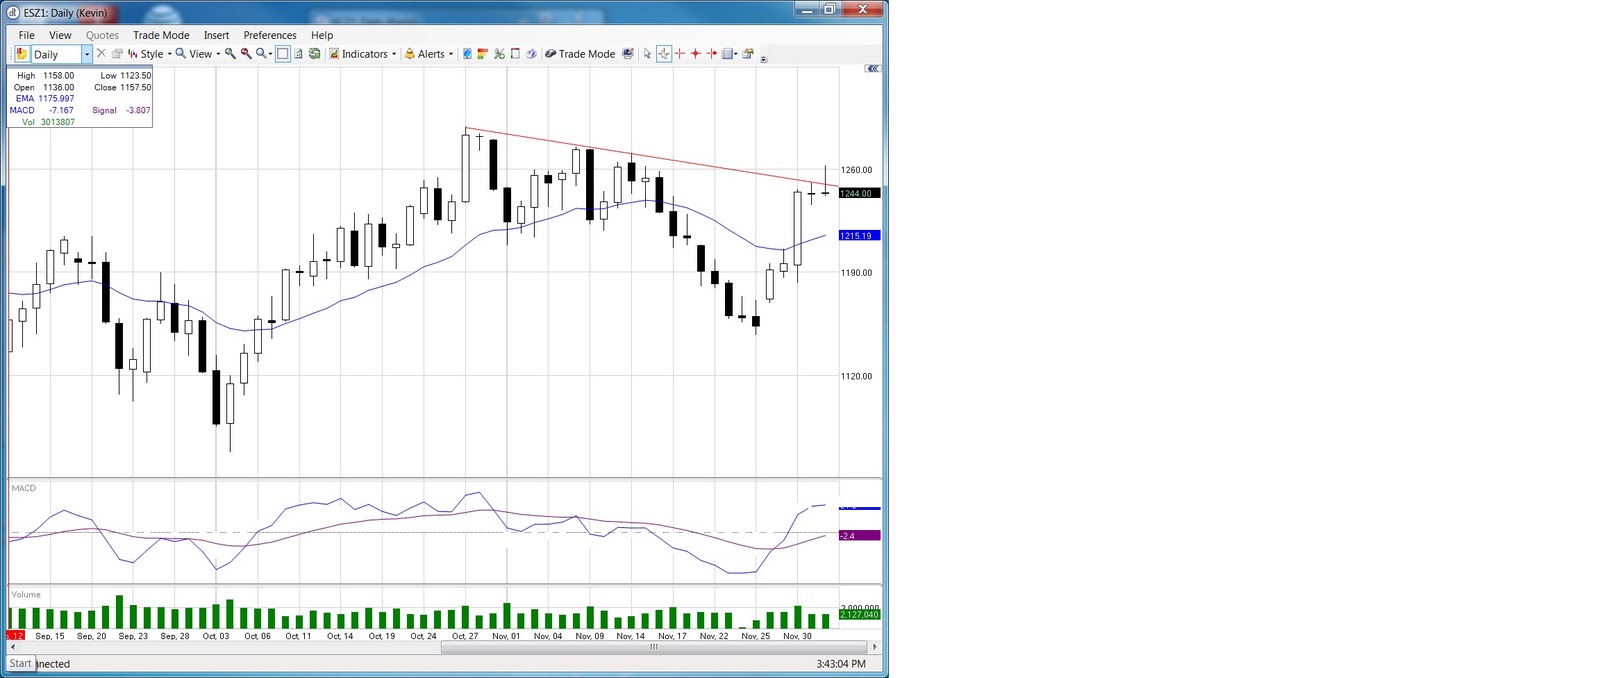
Last week was an interesting one, for the stock market and futures. Stock indices and currency futures had big days on Monday, baaed on strong black Friday sales, and again on Wednesday because of apparent central bank support on the global debt concern. For the start of this coming week, I am seeing several set ups that look like good short candidates. I have posted some charts below, but in the ES (and I am referring to futures in this post), Eurodollar, and Canadian dollar, I am seeing price action running into resistance.

The ES (S&P mini contract) and Canada dollar futures are both running into trendline resistance, and have sold off on Friday, so I am biased to more downward momentum on Monday. For the ES, a price break below Friday's low would trigger a short entry.

The Euro dollar had a Taylor short sell day on Friday, so a good entry might come from looking at an intraday chart. Support would be found at the downward sloping trendline. The Loonie has fallen below its trendline, so again, look at intra day charts for a possible entry on the short side. Sopport would be at the 20 day EMA.

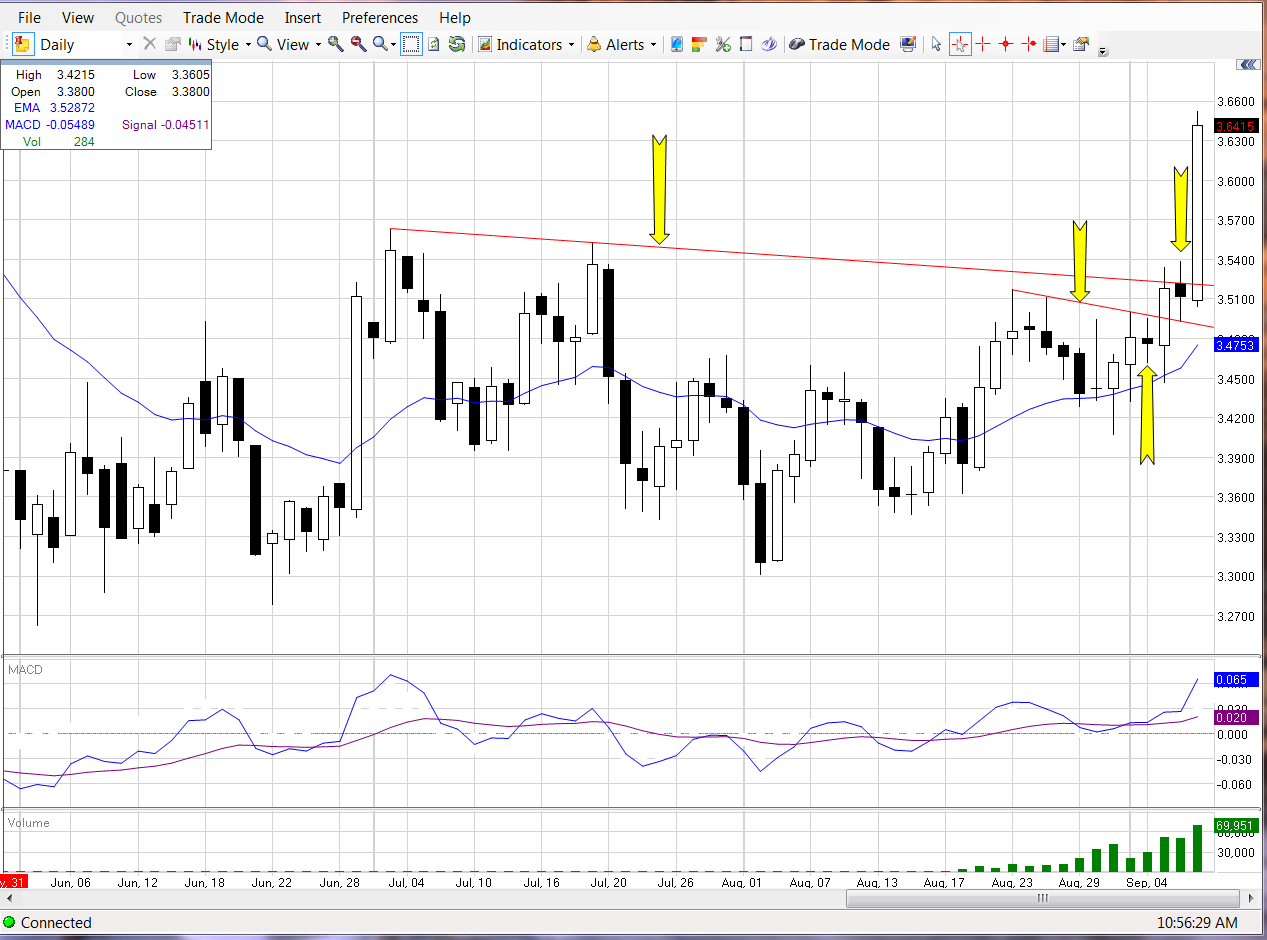
Copper looks more bullish, with a possible buy signal above Wednesdays high of 3.6350.

Thanks for reading, and enjoy the weekend. I am still figuring out how to post the best looking charts- sorry for these.


Saturday, February 5, 2011

More on risk

I wanted to expand the discussion on risk, to build on the definition from the last post, and get into levels of risk that are generally considered acceptable, as well as mention the concept of "portfolio heat".

As I mentioned in the last post, many investors and traders do not understand the concept of risk, and so, are not in a position to be able to accept that risk. Risk is the difference between purchase price and stop level, times the number of shares or contracts taken on. The investor that takes on a position in a stock, ETF, or mutual fund, and does not know the price that he will get out, has not defined the risk that has been taken on. In fact, they will not know how much they risked, unless the position reverses and goes so low that they cannot take it anymore. Pain has defined risk for them. Many investors learned this in past bear markets.

Most trading authorities agree that an acceptable level of risk/position is around 0.5% to 1.0% of total account value. In a fictitious $100,000 sized account, 1% would be $1000. So simply divide the difference between purchase price and stop level into $1000, and you get the number of shares or contracts (for futures) that you can purchase.

Portfolio Heat- this is the total amount of open risk on the account an any given time. assuming that you have multiple positions on, and have been moving your stops up to protect profits, calculate the risk per position, and sum the total risk over all positions compared to the account. Most agree that 5% portfolio heat is acceptable. That means that if all positions reverse, and get stopped out, that you only suffer a 5% drawdown in value.

Thanks for reading- I hope that this helps.

Saturday, January 22, 2011

ETF's vs stocks

I wanted to share the approach that I take regarding stock investing, especially for the part time investor or trader. Many people want to know what stock to buy- what is hot, what is going up? Successful investors are more concerned with managing risk and following a decent trend, than chasing the hot momentum stock. In fact, I don't buy stocks any more- I trade ETF's (exchange traded funds). Why- is is simpler. Individual stocks have too many variables to pay attention to, if you are invested in any given stock, you need to know when an earnings announcement is due- it could affect the price significantly. So many things can change in a company that can have a hit on the stock. There are so many ETF's (check out profunds.com for a listing of some of the ones I trade), you can trade the indexes, metals, energies, etc. I'll get into that shortly.

Many people invest in an index fund, and are happy getting the basic market performance- this is easy to with ETF's. I'll use the S&P 500 as one example. The common ETF for that index is SPY. It is bought and sold just like a stock, and has none of the fund management fees that an index mutual fund has. It will also buy and sell when you place the order, not at the end of the day as a fund does. If you are looking for a more aggressive return, look into the leveraged ETF's- in the case of the S&P 500, look at BGU. It is a triple leveraged ETF- if the index moves 1%, BGU moves approximately 3%. It goes down as well as up, so be aware of the damage that leverage can do, if you do not manage risk.

To discuss risk a little, you have to understand and manage risk in any trade. Is risk what you spend on a stock? No. If you buy 100 shares of Apple (AAPL) at $320/share, you have spent $32,000 on that stock. Are you risking $32,000? Only if you are willing to stay in it until the price goes to zero. When you buy any stock or ETF, you have to know in advance when you will get out. At what price level will you decide that owning Apple is a bad ides, and sell it? If the answer to that question is "I don't know", then you should not be owning it at all, because you have no idea how much of that $32,000 you are really risking. On the other hand, if you bought AAPL at $320, and decide that if it drops to $300/share that you will get out of the trade, then you are risking $20/share, or $2000 of your money ($20/share, times your 100 shares). That is understanding risk per trade.

To wrap up for now, the other reason that I trade only ETF's is because I also trade commodity futures. I follow approx 10 markets, and don't have time each evening to also run an analysis on 20 or so stock charts. I can do that on 3-4 ETF's, and trade those.

More on risk to come......

Go Bears!

Sunday, September 26, 2010

Current picture

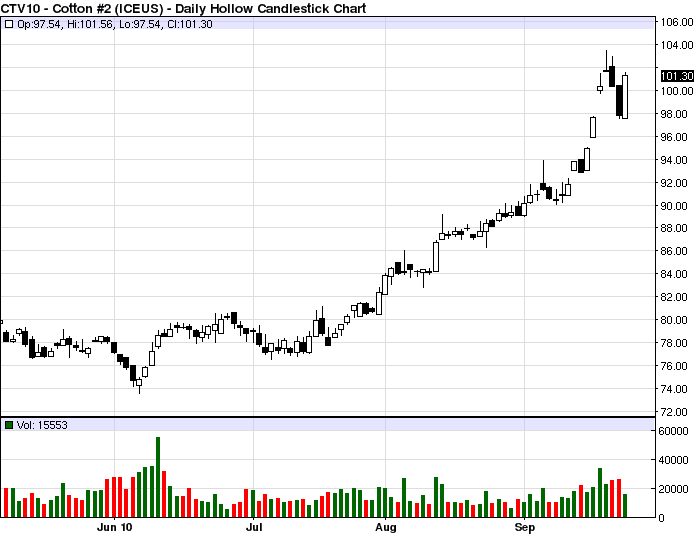
I wanted to start off with a current sense of the markets are doing, and then discuss possible opportunities. Despite government comments that inflation is not a concern, there have been rising commodity prices since July. I have included charts for the CRB commodity index, showing what raw materials have been doing. Also, you will note charts for gold, which often goes up in a poor market, as investors flee to value. Cotton has also been rising in part to poor weather in India, and additionally, rising demand. Click on any chart for a larger view.


While stock prices rose in early July, they declined  throughout August. Refer to the chart of the S&P 500, which I use as a representation of the overall market, rather than the Dow 30.


Regarding current opportunities, I am looking at Apple (AAPL), Bidu.com (BIDU) and the leveraged ETF's for the Nasdaq and S&P, which are QLD and BGU respectively. The market has risen a great deal since the start of September, so I would be looking for a small pullback as a buying opportunity.

Thursday, March 11, 2010

Non-trade

As you can tell, the trade set up in the below post did not happen. This current market is so hot, that the prices just kept powering upward. It will reverse at some point, but any short trades will be for a bar or two to control risk.

Sunday, March 7, 2010

Starting again....

It has been far longer than I would have liked, letting this blog sit idle. I don't know why- perhaps I just lost interest for a while. In any case, I am re-motivated to keep at it. Part of my renewed interest is due more in part to re-focusing on my trading, and really staying committed to running it as a business. The blog posts will be more oriented towards trade set ups, macro commentary, and miscellaneous issues that will, I am sure, crop up from time to time.

On to the above chart-

There are 3 trade patterns setting up here, and these are all based on the work of Linda Raschke, from her Street Smarts book, and material from her TAG conference in 1995 on 5 patterns using a modified MACD momentum indicator. These trade set ups on BGZ are-

1. Turtle soup plus one
2. 3 day unfilled gap reversal
3. 10 day divergence (where price makes a lower low and the indicator makes a higher low over a 10 day period)

I have placed a stop limit buy order for BGZ which is a triple leveraged ETF for the what is basically shorting the S&P 500. The order is placed just above Friday's high, indicating a move to fill the gap. If filled, a protective sell stop will be put under Friday's low. Keep in mind that I am a short term trader, unless I see a change in trend coming, such as at the beginning of March of last year. Also note, March 10 of 2009 was a reversal based on the 10 day divergence pattern. Look at a chart of AAPL, and you will see it clearly.

A chart is below-

Count back to the last low on 2/23, and you will see that it is 9 days to the most recent low on 3/9. So, to be correct, we are looking at an 9 day divergence, but this pattern occurs nearly always over a 10 day period.

My market bias right now is bearish, despite the recent strong rally over the past month. There are a lot of reasons for this, that I will not go into on this post, other than to point at the increasing debt levels, and dependence on consumer spending to pull us out of this recession. I am also looking to see if the Dow can rise above the 10725.43 level set on 1/19. This is the 50% level from the 2002 low to the 2007 high. While I will not claim to be an expert in Dow theory, this is a critical resistance level, and I want to see if we can get back above it. Until it does, I will continue to trade 3-5 day price swings and manage risk tightly.

Until next time...

Sunday, September 21, 2008

The changing market landscape


Well, I have to say that these are the most interesting times that I have seen in the markets since I started trading, and that includes the Internet bubble, and subsequent bursting of it. Since my last post, we have seen the market (NASDAQ) basically in a descending triangle, recently breaking below the lower trend line.

After the Fed announced that they would cover the bad debt that occurred for a variety of reasons, and then that the financials could not be to be shorted, we saw a huge up day on Thursday, followed by another on Friday. I don't like what is happening, since the responsibility is being taken off of the true offenders- the banks, mortgage companies, and those who knowingly took on more debt than they could afford- the homeowners and speculators. What bothers me even more, is that the government and the broken banks are pointing the finger at the short sellers. I do have a problem with naked short selling- shorting when the shares are not available (but this is legal), and I will agree that there has been a lot of piling on of the shorts, driving the stock prices of the banks into the ground.

In my opinion, a better solution is to re-instate the uptick rule for shorting. I think that this would add some level of order to the selling, and get things back under control. The shorting did drive the stock prices down, which changed some of the credit ratings, so there is a correlation here. All in all, stopping the short induced bleeding was a good idea, and I do think that the uptick rule should be put back in place, as I mentioned above.
My concern is the basic buying and selling relationship of an orderly marketplace is being messed up. When you have shorts selling, you are providing shares to the buyers. Now that short selling is being restricted, it may end up setting up a situation where there are fewer shares for sale, artificially driving up prices, as buyers compete for fewer shares. Now, what happens when the shorting is allowed to happen again- do we see another down slide, or does order return to the market?

In the meantime, I am not trading this market unless I see some sense return to it. I can't allow myself to trust this rally, because the true issues have not been resolved.

Keep your power dry, and control your risk.

Monday, May 26, 2008

Nasdaq at resistance


The charts of the Nasdaq look like it will be an interesting week. I have a weekly chart attached, because I believe that the weekly charts take a lot of the daily noise out of the picture, and allow me to see the larger trend better. In the case of the Nasdaq, you can see that price has pulled back from resistance in a bearish engulfing candle, but has not yet broken the channel that it has been in since March. Price this week has been less than the week prior, so I am not sure that this is a powerful bear signal.
We are entering a seasonally thin environment as we approach the summertime, and given the factors that are in play, such as oil, recession fears, etc, I suspect that we will see a break of the channel, and a swing to the downside. The other thing that I am noticing, is that there seem to be a lack of good trading patterns on strong stocks. I was also reading on Reuters this morning that the Chinese markets slumped today on the same fears that I mentioned.
A point that I touched on in an earlier post was how I use the Nasdaq to give a sense of the overall market direction. I will use the other key indexes, the DOW, NYSE, and S&P 500 for rally attempt follow through days, but I have noticed that the Nasdaq seems to set up more reliable patterns that any other index chart. By tradeable patterns, I am referring to 5 wave declines, 3 wave A-B-C pullbacks, double bottoms with tests of the midpoint, 2B bottoms, etc. When these set up, I can be pretty sure that the strong momentum stocks will move out of their patterns as well.
I'll include charts of examples of these in future posts. Until then, I hope that you had a great Memorial Day holiday.

Sunday, May 11, 2008

Current trading environment


Well, it has been a while. This current environment has been getting the best of me, because of a lack of discipline on my part. The downtrend that we saw start right after Christmas really put me to sleep. I was so content to sit on my hands, that I did not take the normal day to day actions and tasks that I should have. By sitting and waiting, I did not watch for new opportunities as I should have.

In any case, I missed some good trades, but am determined to not let that happen again. I did take some resent trades with SINA and ASTI, but the Nas was pretty extended, and the environment was high risk. The trades went nowhere as the general market reversed. I have been finding that when I align my trades to what the market is doing, specifically, the Nasdaq, the odds of success increase greatly.


I have an order in for SPWR, which has formed a nice decline, finding support at the 38% fib value, as well as both the 50 day and 200 day EMA's. Here's hoping that the channel breaks to the upside. Feel free to click on the image for a clear, and larger view.

Here's hoping for better days ahead, and Happy Mother's Day.

Wednesday, February 6, 2008

The risk of NOT taking a trade

One topic that I have been giving some thought to, is risk. We all know that there is a level of risk associated with taking any given trade. Assuming that we have a method that allows us to measure the risk prior to placing a trade, we know exactly what the level of risk is. This can be measured in dollars, or percentage of account value- normally traders use percent of account to measure R or risk.

If your trading style does not allow you to measure risk (entry price - stop price x number of shares), this there are other discussions that need to take place! I cannot imagine NOT being able to meaure my risk/trade, but that's just me.

Recently, I have been thinking not about the risk of taking a trade, but the account risk associated with NOT taking a trade. If you are trading a strategy that has a fairly high probabliliy of winners to losers, and you also know the average expectancy (reward/risk) per trade, then you also know the dollar risk of not taking the trade when market conditions and specific chart patterns set up.

This way of looking at trade set up's has really changed my thinking. Now, current market conditions make it tricky to find good trade set up's, so it's easy for me to sit on the sidelines and wait for better days (and think about stuff like this).

BTW, I trade a fairly high probability swing trade method, and I track all R multiples in a spreadsheet, so I know what my projected reward/trade is, as well as loss risk. How can I measure reward before the trade is taken? By looking at the upcoming resistance levels that price will face, and taking those trades that should have a 3:1 reward profile or better. In many cases the reward price exceeds the 3:1 level, so I am really trying to measure a minimum reward level.

In any case, using 3:1 allows my to look at the risk of not taking a given trade, compared to the risk of loss.

Give this some thought, in relation to your trading method, and you may see things from a different point of view.

Tuesday, January 1, 2008

Thoughts for the New Year

First off, I want to apologize for the lack of postings. I allowed myself to become distracted with other issues, and this affected my blogging, as well as my trading. Trading well requires constant effort and self-work, and I allowed myself to lose my edge.

That said, I want to go through some of the goals that I have for 2008- these are related to Tharp's 10 tasks of trading, and are not tied to any profit goals. It is my belief that if I focus on the process of trading, and manage my trades according to my rules and strategies, then the profits will come.

The key areas of focus for 2008 are to take the trades that my screening software identifies, and manage them well (not taking profits too early). These tasks (as developed by Van Tharp from his modeling of top traders)-

Taking action, and monitoring the trade.

There are 10 tasks in total, and these are detailed in his "Peak Performance Course for Traders" program.

The other main goals are continuation goals- meaning that I am doing a pretty good job on those now, but I really need to make sure to maintain that effort. In addition to these, I want to work on continual improvement with regards to my trading, nutrition and exercise program, and spiritual development.

One thing that I have noted this past year, is that the Nasdaq seems to set up more reliable patterns than the other indices. I use the Nas 100 (NDX) to see how the large cap techs are doing, but the Nas sets up better support and resistance, fib retracements, etc., so I use it as my main market indicator.

Other than that, I will try to post weekly, share my learnings, successes and failures. Have a happy and healthy 2008, and good hunting!

Sunday, September 16, 2007

The education of a trader- part 2

I want to continue this posting series by getting into what I started learning, after I realized that there were so many options open to me. In addition to working on understanding the basics of charting (because it felt right, as compared to economic analysis, or fundamental analysis), I started to also understand that there was a psychological side of trading. This is expanded on by Van Tharp, as well as Brett Steenbarger and Mark Douglas. A comment by Alan Farley finally became clear to me after much puzzling- he stated that you can't make money with TA (technical analysis).

This one really confused me, because Farley trades price and volume patterns, and is often unaware of a company's fundamentals. What I gradually came to understand is that analysis is not trading. The issue that I had been struggling with was not a poor level of TA understanding, but trading skill sets. By this, I mean mental skill sets. Over time, I had shown myself that I could scan for and find solid candidates- great patterns that went on to do exactly what I thought they would (although not all picks are winners, of course), but there enough profitable trades to show myself that I had a very profitable strategy.

Here was the issue- I was either not taking the trades (either through not placing the orders, or by not reviewing my watchlists enough to catch the entries until they were too late). In both cases, I was showing signs of self-sabotage. The key was to master trading, not try and master TA. The best way that I found for this- trade so small, that the money did not matter. This way, the trader is so focused on good trade management, that he or she can stay in the flow of trading, and not start to worry about profits or losses. Each loss had to become a form of feedback, and not a threat.

This where I am now- trading small lots, and focusing on staying in the moment, managing the trade, and becoming the best trader that I can, and not the best analysist.

Monday, September 3, 2007

The education of a trader- part 1

I started trading during what was probably the worst time a new trader could possibly start learning this craft- the summer of 1999. Knowing only that I wanted to open a brokerage account, and start learning how to make money at this, I bought a copy of the latest Motley Fools book, reading their website, and buying stocks through a newly opened Schwab account.

The problem was- I did great! By the end of the year, I was up more than 80%. This was by buying the types of stocks that the Fools said to- those great companies that you know about. So I bought Gap, Microsoft, Cisco, and Coke. Then came 2000. By this time, I was also subscribing to a tech newsletter, and bought when it said to, and never sold- why would anyone want to ever sell?

Making a long story short- I bought the dips as the newsletter said and never knew when to sell. This was in part due to my lack of understanding, but also because the analysis and newsletter writers all screamed about the tremendous buying opportunities on these "dips". "Back up the trucks!". By the time the bleeding stopped, I was down by more than 75%, and closed out the account.

After the pain had subsided, I started again, but began reading more about charts and technical analysis. I started reading IBD, and learning about CANSLIM, about swing trading, position trading, day trading, beating the DOW, mutual fund trading, on and on. Then I learned about the psychological aspect- how one trades their beliefs about the markets, about self sabotage, then about business plans, worst case contingency planning, and having multiple systems for varying market conditions.

Needless to say, my head was spinning. What I really learned was- there are many many ways to trade the markets, scads of time frames, entry methods, exit methods, and trade management methods. This freedom allows for unlimited ways of making, or losing money. I needed to develop a trading method that worked for me, and to create a set of guidelines that I could test, and then follow.

More to come....