Search This Blog

Saturday, June 30, 2012

When to be careful on a buy day

On Wednesday, I put on a buy day long position on the August gold futures (GC), and was stopped out of the trade. While this happens now and then, in retrospect, there was good reason to have been extra careful, or to have avoided the trade altogether. The chart below shows the set up day- a buy day, a sell day, followed by a sell short day. This should have set up a Taylor buy day, where the sell short day low is taken out, then a reversal takes place.


For a buy day entry, I look for three things to take place-

1. A break of the previous day's low.
2. Price reversal above that previous low.
3. A break of the 20 bar exponential moving average on a 15 minute chart.

See the chart below, and you will see the horizontal red line that shows the previous day's low, a consolidation of price, and the break above the low, which also broke the 20 bar ema. Following the breakout, price fell, and I was stopped out, as the lower trend line was taken out. 


Here is the daily chart that show how the day ended up- lots of chop back and forth, with no real directional movement-


So what is to be learned from this? I asked Scott Hoffman (my broker and a great Taylor Trading educator) what he thought, and why he noted the buy day of GC as "careful" in his Swing Trader Insight service (worth looking into if you want to trade the TTT method). His comment was that the setup day was an inside day, in addition to having been a shorting day. This indicates that a breakout may be coming, as it was not a true sell short day. A better trade would have been to go long if the previous day had been a proper sell short day.


Sunday, June 24, 2012

Selling short on a buy day

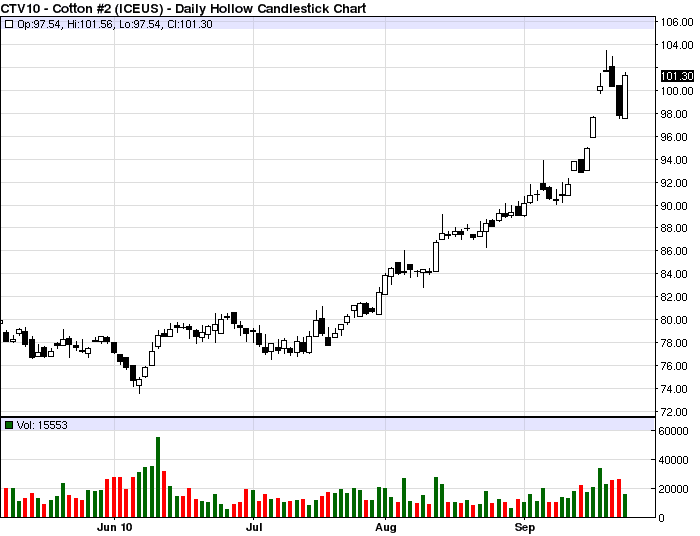
This past Friday, sugar futures presented a perfect example of a shorting opportunity on a Taylor buy day. The second chart below is the daily bar chart for the October contract for SB. Monday set up a breakout- a doji bar just below the 20 day ema. The breakout did occur on Tuesday, with Wednesday carrying further momentum, often a sell short day after a breakout.

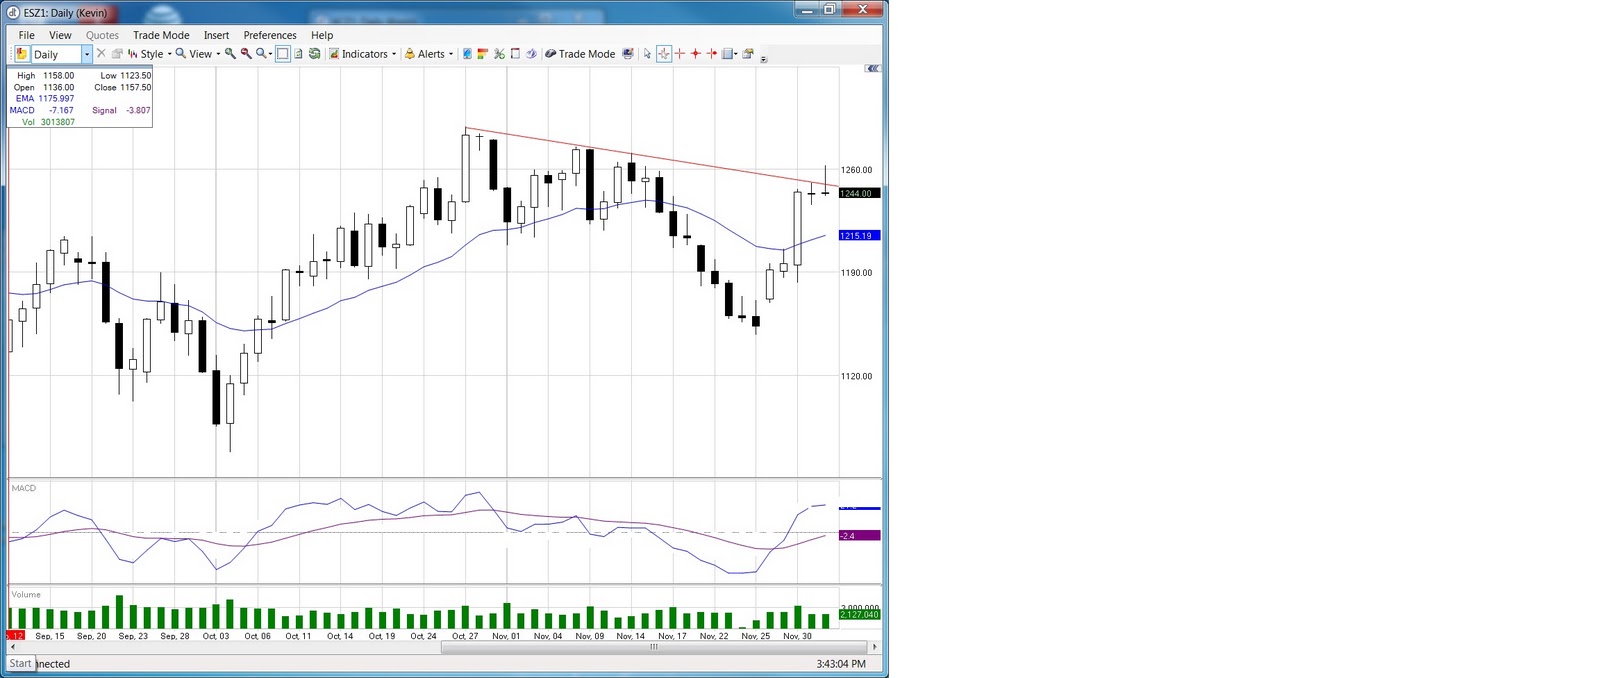
On Thursday, we see a classic Taylor sell short day bar. The previous high was taken out, then price reversed through that high, giving a signal to short. You will see in the chart directly below, that the horizontal red line indicates the previous high, with it being taken out at 10:00 am. Price tested the morning high, then broke down again at 11:30 am (see the yellow arrow). I use the 20 bar ema on a 15 minute chart to help validate the trend reversal, so the 11:30 bar is my entry signal.


This shorting day sets up the Taylor buy day. The bias coming into Friday would be to look for a violation of the Thursday low, then a reversal into an uptrend for the day. Instead, price opened above the Thursday low, dipped a little, then climbed before falling. How can this be traded? I have found that the 50% fib retracement is a good indication of whether or a not a trend will continue, or fail. Other classic fib levels can be used, but even going back to Charles Dow, and then taught well in Victor Sperandeo's book Trader Vic, the 50% level is pretty reliable, and can be used an trend entry level if you are not able to catch a buy day or sell short day entry earlier. For more on this, follow Scott Hoffman's blog (click on his name under "trading links"), or go to Richard Russell's site, Dow Theory Letters.

As you will note in the below chart (15 minute bars), the 50% retracement principle comes into play clearly. I have drawn fib level lines, from Thursday's high (double top), down to the low just after the open on Friday. The high on Friday tested, then failed at, the 50% fib level (see the horizontal blue line). Again, I use the 20 bar ema on the chart as a trend reversal validation tool, so the short signal for me came at 9:00 am, with the wide range bar at 10:45 indicating that the position should be closed out. A bar like this is often a sign of an exhaustion move.


So, while the day after a sell short day of often a buy day, if the previous day's low is not taken out, but price climbs, this may be indicative of continued selling pressure, and a "buy day, high made first" setup may present itself as an opportunity to short.

Friday, February 3, 2012

Whipsawed in a trade

I want to provide an example of a trade that was a losing trade, even though all of the trader actions were correct. More importantly, we need to look at the mental states involved, and what could have happened. This morning, there was a breakout setup in soybean futures. Being able to be at the screens at the open (9:30 am CT), I went long as soon as price went above the last high (the overnight session), and had my stop in place. Price then reversed against my position. Here is where new traders can freeze, thinking that the trade will come back and go their way. If a b/o reverses, you have to get out.

Fortunately, I closed the long position, and went short. Experience has shown that a failed breakout can yield a good trade as price goes against the trapped longs. In this case, price reversed again, and went well above my short entry. At that point, I had no business being in the trade, and covered the short.


As you can see above, the 5 minute bar at the open created a crazy candle. The lesson here is- this stuff happens, and the key is that as long as you know that you trade a system that has a positive expectancy, you have to take all signals, both long and short. There will be losing trades now and then, but we are trading on probabilities, not absolutes.


Saturday, December 3, 2011

Trades for Monday 12/5/11

Last week was an interesting one, for the stock market and futures. Stock indices and currency futures had big days on Monday, baaed on strong black Friday sales, and again on Wednesday because of apparent central bank support on the global debt concern. For the start of this coming week, I am seeing several set ups that look like good short candidates. I have posted some charts below, but in the ES (and I am referring to futures in this post), Eurodollar, and Canadian dollar, I am seeing price action running into resistance.

The ES (S&P mini contract) and Canada dollar futures are both running into trendline resistance, and have sold off on Friday, so I am biased to more downward momentum on Monday. For the ES, a price break below Friday's low would trigger a short entry.

The Euro dollar had a Taylor short sell day on Friday, so a good entry might come from looking at an intraday chart. Support would be found at the downward sloping trendline. The Loonie has fallen below its trendline, so again, look at intra day charts for a possible entry on the short side. Sopport would be at the 20 day EMA.

Copper looks more bullish, with a possible buy signal above Wednesdays high of 3.6350.

Thanks for reading, and enjoy the weekend. I am still figuring out how to post the best looking charts- sorry for these.


Saturday, February 5, 2011

More on risk

I wanted to expand the discussion on risk, to build on the definition from the last post, and get into levels of risk that are generally considered acceptable, as well as mention the concept of "portfolio heat".

As I mentioned in the last post, many investors and traders do not understand the concept of risk, and so, are not in a position to be able to accept that risk. Risk is the difference between purchase price and stop level, times the number of shares or contracts taken on. The investor that takes on a position in a stock, ETF, or mutual fund, and does not know the price that he will get out, has not defined the risk that has been taken on. In fact, they will not know how much they risked, unless the position reverses and goes so low that they cannot take it anymore. Pain has defined risk for them. Many investors learned this in past bear markets.

Most trading authorities agree that an acceptable level of risk/position is around 0.5% to 1.0% of total account value. In a fictitious $100,000 sized account, 1% would be $1000. So simply divide the difference between purchase price and stop level into $1000, and you get the number of shares or contracts (for futures) that you can purchase.

Portfolio Heat- this is the total amount of open risk on the account an any given time. assuming that you have multiple positions on, and have been moving your stops up to protect profits, calculate the risk per position, and sum the total risk over all positions compared to the account. Most agree that 5% portfolio heat is acceptable. That means that if all positions reverse, and get stopped out, that you only suffer a 5% drawdown in value.

Thanks for reading- I hope that this helps.

Saturday, January 22, 2011

ETF's vs stocks

I wanted to share the approach that I take regarding stock investing, especially for the part time investor or trader. Many people want to know what stock to buy- what is hot, what is going up? Successful investors are more concerned with managing risk and following a decent trend, than chasing the hot momentum stock. In fact, I don't buy stocks any more- I trade ETF's (exchange traded funds). Why- is is simpler. Individual stocks have too many variables to pay attention to, if you are invested in any given stock, you need to know when an earnings announcement is due- it could affect the price significantly. So many things can change in a company that can have a hit on the stock. There are so many ETF's (check out profunds.com for a listing of some of the ones I trade), you can trade the indexes, metals, energies, etc. I'll get into that shortly.

Many people invest in an index fund, and are happy getting the basic market performance- this is easy to with ETF's. I'll use the S&P 500 as one example. The common ETF for that index is SPY. It is bought and sold just like a stock, and has none of the fund management fees that an index mutual fund has. It will also buy and sell when you place the order, not at the end of the day as a fund does. If you are looking for a more aggressive return, look into the leveraged ETF's- in the case of the S&P 500, look at BGU. It is a triple leveraged ETF- if the index moves 1%, BGU moves approximately 3%. It goes down as well as up, so be aware of the damage that leverage can do, if you do not manage risk.

To discuss risk a little, you have to understand and manage risk in any trade. Is risk what you spend on a stock? No. If you buy 100 shares of Apple (AAPL) at $320/share, you have spent $32,000 on that stock. Are you risking $32,000? Only if you are willing to stay in it until the price goes to zero. When you buy any stock or ETF, you have to know in advance when you will get out. At what price level will you decide that owning Apple is a bad ides, and sell it? If the answer to that question is "I don't know", then you should not be owning it at all, because you have no idea how much of that $32,000 you are really risking. On the other hand, if you bought AAPL at $320, and decide that if it drops to $300/share that you will get out of the trade, then you are risking $20/share, or $2000 of your money ($20/share, times your 100 shares). That is understanding risk per trade.

To wrap up for now, the other reason that I trade only ETF's is because I also trade commodity futures. I follow approx 10 markets, and don't have time each evening to also run an analysis on 20 or so stock charts. I can do that on 3-4 ETF's, and trade those.

More on risk to come......

Go Bears!

Sunday, September 26, 2010

Current picture

I wanted to start off with a current sense of the markets are doing, and then discuss possible opportunities. Despite government comments that inflation is not a concern, there have been rising commodity prices since July. I have included charts for the CRB commodity index, showing what raw materials have been doing. Also, you will note charts for gold, which often goes up in a poor market, as investors flee to value. Cotton has also been rising in part to poor weather in India, and additionally, rising demand. Click on any chart for a larger view.


While stock prices rose in early July, they declined  throughout August. Refer to the chart of the S&P 500, which I use as a representation of the overall market, rather than the Dow 30.


Regarding current opportunities, I am looking at Apple (AAPL), Bidu.com (BIDU) and the leveraged ETF's for the Nasdaq and S&P, which are QLD and BGU respectively. The market has risen a great deal since the start of September, so I would be looking for a small pullback as a buying opportunity.