Search This Blog

Saturday, December 3, 2011

Trades for Monday 12/5/11

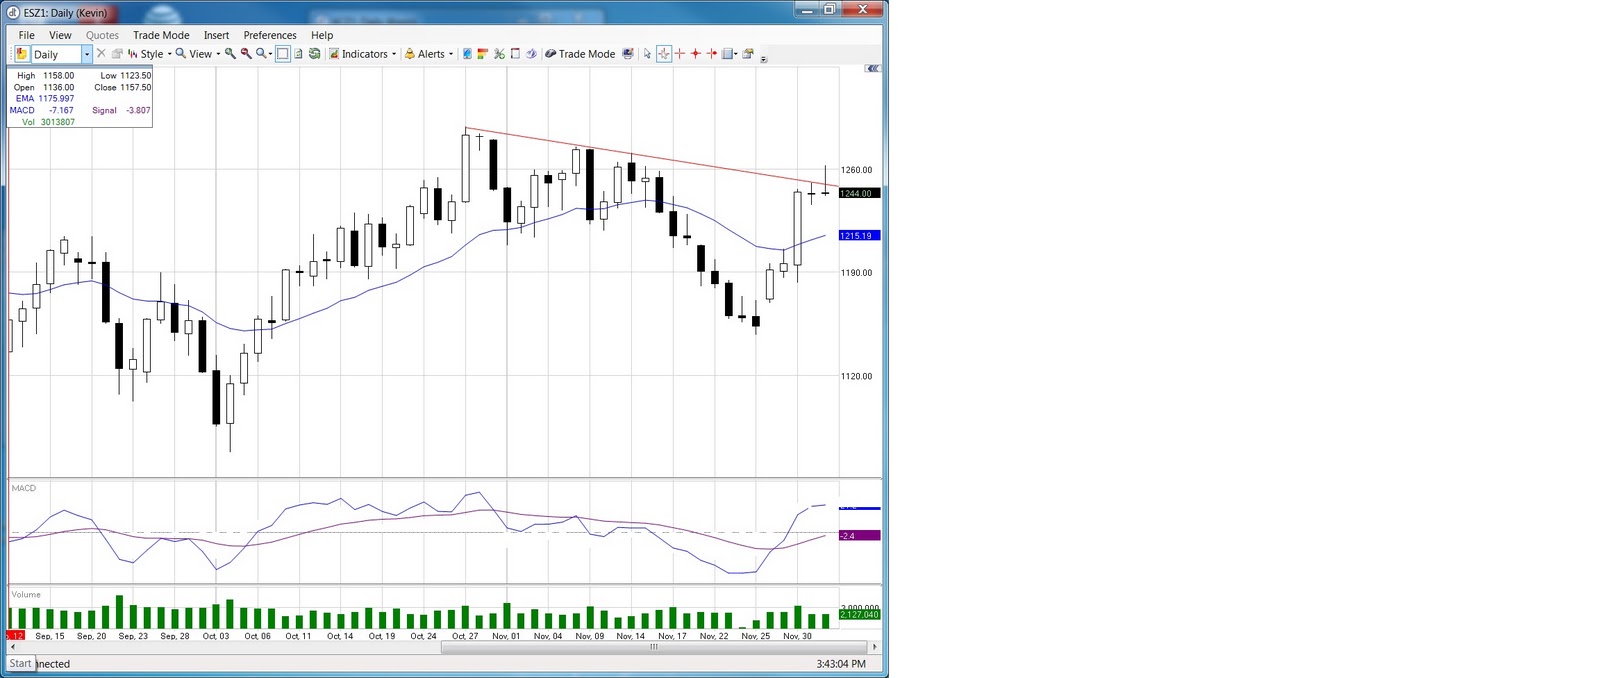
Last week was an interesting one, for the stock market and futures. Stock indices and currency futures had big days on Monday, baaed on strong black Friday sales, and again on Wednesday because of apparent central bank support on the global debt concern. For the start of this coming week, I am seeing several set ups that look like good short candidates. I have posted some charts below, but in the ES (and I am referring to futures in this post), Eurodollar, and Canadian dollar, I am seeing price action running into resistance.

The ES (S&P mini contract) and Canada dollar futures are both running into trendline resistance, and have sold off on Friday, so I am biased to more downward momentum on Monday. For the ES, a price break below Friday's low would trigger a short entry.

The Euro dollar had a Taylor short sell day on Friday, so a good entry might come from looking at an intraday chart. Support would be found at the downward sloping trendline. The Loonie has fallen below its trendline, so again, look at intra day charts for a possible entry on the short side. Sopport would be at the 20 day EMA.

Copper looks more bullish, with a possible buy signal above Wednesdays high of 3.6350.

Thanks for reading, and enjoy the weekend. I am still figuring out how to post the best looking charts- sorry for these.


Saturday, February 5, 2011

More on risk

I wanted to expand the discussion on risk, to build on the definition from the last post, and get into levels of risk that are generally considered acceptable, as well as mention the concept of "portfolio heat".

As I mentioned in the last post, many investors and traders do not understand the concept of risk, and so, are not in a position to be able to accept that risk. Risk is the difference between purchase price and stop level, times the number of shares or contracts taken on. The investor that takes on a position in a stock, ETF, or mutual fund, and does not know the price that he will get out, has not defined the risk that has been taken on. In fact, they will not know how much they risked, unless the position reverses and goes so low that they cannot take it anymore. Pain has defined risk for them. Many investors learned this in past bear markets.

Most trading authorities agree that an acceptable level of risk/position is around 0.5% to 1.0% of total account value. In a fictitious $100,000 sized account, 1% would be $1000. So simply divide the difference between purchase price and stop level into $1000, and you get the number of shares or contracts (for futures) that you can purchase.

Portfolio Heat- this is the total amount of open risk on the account an any given time. assuming that you have multiple positions on, and have been moving your stops up to protect profits, calculate the risk per position, and sum the total risk over all positions compared to the account. Most agree that 5% portfolio heat is acceptable. That means that if all positions reverse, and get stopped out, that you only suffer a 5% drawdown in value.

Thanks for reading- I hope that this helps.

Saturday, January 22, 2011

ETF's vs stocks

I wanted to share the approach that I take regarding stock investing, especially for the part time investor or trader. Many people want to know what stock to buy- what is hot, what is going up? Successful investors are more concerned with managing risk and following a decent trend, than chasing the hot momentum stock. In fact, I don't buy stocks any more- I trade ETF's (exchange traded funds). Why- is is simpler. Individual stocks have too many variables to pay attention to, if you are invested in any given stock, you need to know when an earnings announcement is due- it could affect the price significantly. So many things can change in a company that can have a hit on the stock. There are so many ETF's (check out profunds.com for a listing of some of the ones I trade), you can trade the indexes, metals, energies, etc. I'll get into that shortly.

Many people invest in an index fund, and are happy getting the basic market performance- this is easy to with ETF's. I'll use the S&P 500 as one example. The common ETF for that index is SPY. It is bought and sold just like a stock, and has none of the fund management fees that an index mutual fund has. It will also buy and sell when you place the order, not at the end of the day as a fund does. If you are looking for a more aggressive return, look into the leveraged ETF's- in the case of the S&P 500, look at BGU. It is a triple leveraged ETF- if the index moves 1%, BGU moves approximately 3%. It goes down as well as up, so be aware of the damage that leverage can do, if you do not manage risk.

To discuss risk a little, you have to understand and manage risk in any trade. Is risk what you spend on a stock? No. If you buy 100 shares of Apple (AAPL) at $320/share, you have spent $32,000 on that stock. Are you risking $32,000? Only if you are willing to stay in it until the price goes to zero. When you buy any stock or ETF, you have to know in advance when you will get out. At what price level will you decide that owning Apple is a bad ides, and sell it? If the answer to that question is "I don't know", then you should not be owning it at all, because you have no idea how much of that $32,000 you are really risking. On the other hand, if you bought AAPL at $320, and decide that if it drops to $300/share that you will get out of the trade, then you are risking $20/share, or $2000 of your money ($20/share, times your 100 shares). That is understanding risk per trade.

To wrap up for now, the other reason that I trade only ETF's is because I also trade commodity futures. I follow approx 10 markets, and don't have time each evening to also run an analysis on 20 or so stock charts. I can do that on 3-4 ETF's, and trade those.

More on risk to come......

Go Bears!
Sunday, September 26, 2010

Current picture

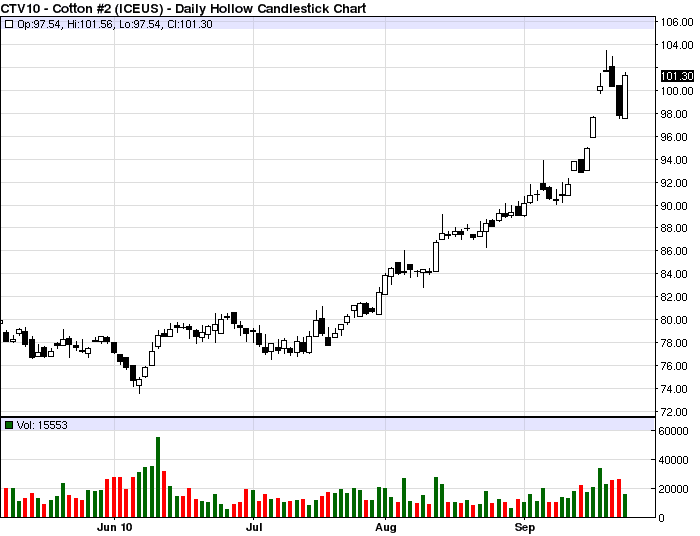
I wanted to start off with a current sense of the markets are doing, and then discuss possible opportunities. Despite government comments that inflation is not a concern, there have been rising commodity prices since July. I have included charts for the CRB commodity index, showing what raw materials have been doing. Also, you will note charts for gold, which often goes up in a poor market, as investors flee to value. Cotton has also been rising in part to poor weather in India, and additionally, rising demand. Click on any chart for a larger view.


While stock prices rose in early July, they declined  throughout August. Refer to the chart of the S&P 500, which I use as a representation of the overall market, rather than the Dow 30.


Regarding current opportunities, I am looking at Apple (AAPL), Bidu.com (BIDU) and the leveraged ETF's for the Nasdaq and S&P, which are QLD and BGU respectively. The market has risen a great deal since the start of September, so I would be looking for a small pullback as a buying opportunity.

Thursday, March 11, 2010

Non-trade

As you can tell, the trade set up in the below post did not happen. This current market is so hot, that the prices just kept powering upward. It will reverse at some point, but any short trades will be for a bar or two to control risk.

Sunday, March 7, 2010

Starting again....

It has been far longer than I would have liked, letting this blog sit idle. I don't know why- perhaps I just lost interest for a while. In any case, I am re-motivated to keep at it. Part of my renewed interest is due more in part to re-focusing on my trading, and really staying committed to running it as a business. The blog posts will be more oriented towards trade set ups, macro commentary, and miscellaneous issues that will, I am sure, crop up from time to time.

On to the above chart-

There are 3 trade patterns setting up here, and these are all based on the work of Linda Raschke, from her Street Smarts book, and material from her TAG conference in 1995 on 5 patterns using a modified MACD momentum indicator. These trade set ups on BGZ are-

1. Turtle soup plus one
2. 3 day unfilled gap reversal
3. 10 day divergence (where price makes a lower low and the indicator makes a higher low over a 10 day period)

I have placed a stop limit buy order for BGZ which is a triple leveraged ETF for the what is basically shorting the S&P 500. The order is placed just above Friday's high, indicating a move to fill the gap. If filled, a protective sell stop will be put under Friday's low. Keep in mind that I am a short term trader, unless I see a change in trend coming, such as at the beginning of March of last year. Also note, March 10 of 2009 was a reversal based on the 10 day divergence pattern. Look at a chart of AAPL, and you will see it clearly.

A chart is below-

Count back to the last low on 2/23, and you will see that it is 9 days to the most recent low on 3/9. So, to be correct, we are looking at an 9 day divergence, but this pattern occurs nearly always over a 10 day period.

My market bias right now is bearish, despite the recent strong rally over the past month. There are a lot of reasons for this, that I will not go into on this post, other than to point at the increasing debt levels, and dependence on consumer spending to pull us out of this recession. I am also looking to see if the Dow can rise above the 10725.43 level set on 1/19. This is the 50% level from the 2002 low to the 2007 high. While I will not claim to be an expert in Dow theory, this is a critical resistance level, and I want to see if we can get back above it. Until it does, I will continue to trade 3-5 day price swings and manage risk tightly.

Until next time...

Sunday, September 21, 2008

The changing market landscape


Well, I have to say that these are the most interesting times that I have seen in the markets since I started trading, and that includes the Internet bubble, and subsequent bursting of it. Since my last post, we have seen the market (NASDAQ) basically in a descending triangle, recently breaking below the lower trend line.

After the Fed announced that they would cover the bad debt that occurred for a variety of reasons, and then that the financials could not be to be shorted, we saw a huge up day on Thursday, followed by another on Friday. I don't like what is happening, since the responsibility is being taken off of the true offenders- the banks, mortgage companies, and those who knowingly took on more debt than they could afford- the homeowners and speculators. What bothers me even more, is that the government and the broken banks are pointing the finger at the short sellers. I do have a problem with naked short selling- shorting when the shares are not available (but this is legal), and I will agree that there has been a lot of piling on of the shorts, driving the stock prices of the banks into the ground.

In my opinion, a better solution is to re-instate the uptick rule for shorting. I think that this would add some level of order to the selling, and get things back under control. The shorting did drive the stock prices down, which changed some of the credit ratings, so there is a correlation here. All in all, stopping the short induced bleeding was a good idea, and I do think that the uptick rule should be put back in place, as I mentioned above.
My concern is the basic buying and selling relationship of an orderly marketplace is being messed up. When you have shorts selling, you are providing shares to the buyers. Now that short selling is being restricted, it may end up setting up a situation where there are fewer shares for sale, artificially driving up prices, as buyers compete for fewer shares. Now, what happens when the shorting is allowed to happen again- do we see another down slide, or does order return to the market?

In the meantime, I am not trading this market unless I see some sense return to it. I can't allow myself to trust this rally, because the true issues have not been resolved.

Keep your power dry, and control your risk.