In one of her articles, Raschke mentions that she skips the first buy or sell swing at the start of a trend, often caused by- an NR7 bar (usually preceding a breakout), 3 small range days (consolidation), the point of a wedge (also consolidation), a breakaway gap, or a rising ADX. The point here is that a move out of congestion or consolidation is often the start of a new trend, or a continuation of a trend, with the consolidation portion being a pause in the trend. This can be seen on a bar by bar basis, as often after a strong breakout bar, there is a consolidation bar, many times a narrow range day, or chop that forms a doji bar. On an intra-day chart, this shows as consolidation.
Below are some charts that show this, starting with Friday's E mini future.

A consolidation can be clearly seen as a descending triangle, with support at the 20 day ema. Friday showed a big breakout, closing at the highs of the day. I got tricked into looking for a SS day after the breakout, but neglected to view things within the larger context of the uptrend, and fact that the b/o day was likely the resumption of that trend out of consolidation.
For a couple of more examples, see the below chart of Crude oil-

Notice the first congestion area. looking like a small box. The breakout bar clears the 20 day ema, possibly signaling the upturn of trend. the bar following tests the ma, but regains it- not a good SS day, but rather, a pause before the next up bar. The price trend then consolidates into a descending triangle at the ema, then moves out of it on high volume. the bar after the b/o bar is a z day, you would not be wise to short it.
Here is a recent example of Copper-
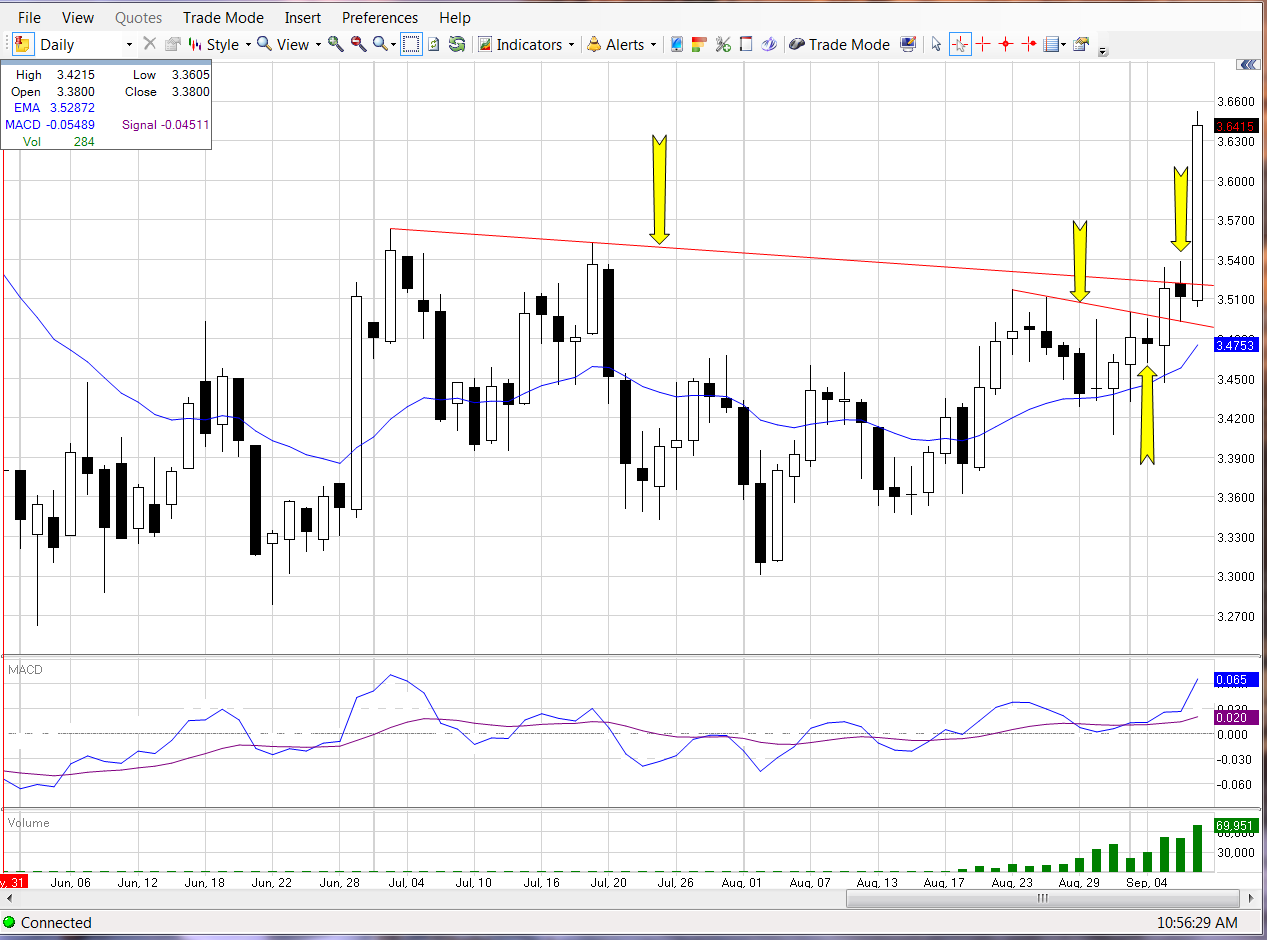
The first breakout moves out of a small triangle that is within a larger pattern. The upper trend line serves as good point for setting a profit target. Note that price broke out following a narrow range doji bar, then formed another consolidation bar just below the upper trend line (just like the bar preceding the first b/o). This first move is part of a First Cross pattern that Raschke writes about often. It is often the second wave of a three wave a-b-c trend move.
Friday brought another breakout, due to the China announcement of more easing. Thursday's day after the b/o could have been traded as a SS day, but the lesson here is to trade the post b/o days carefully, especially if they seem to be indicating a change of trend.
Finally, take a look at the multiple breakouts in this chart of gold futures. See the small and larger triangle breakouts, and note that the b/o bar has increased volume compared to the day before. The third b/o is from a small bull flag, a consolidation pattern. The last b/o is very interesting. Thursday, price broke out of a pattern of three small range days (mentioned above), but closed weakly. It did close above Tuesday's high, and the sell off Friday morning may have well sucked in a lot of shorts before reversing. The lesson is to be careful shorting right after a breakout from consolidation.

Use this tendency to stay safe, and perhaps use as a criteria for holding onto a b/o bar for more than just the one day. All of that said, there does seem to be good reason to short after a breakout, when the trend is NOT changing, but I will post regarding that, at another time.