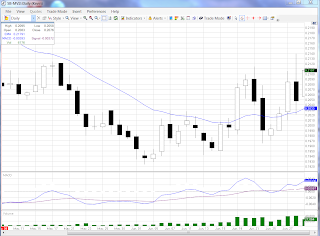
Below is 15 minute chart, that shows the sell day high, the entry bar for the short sale breaking the sell day high and 20 bar ema, as well as a trend line break, which further confirms the trend change.
What you can also see, is the wide range sell off bar at 9:30 that is a great indication to cover the short, and take profits, when this many traders are selling, it's a great idea to cover the short position. As Linda Raschke said- "when the ducks quack, feed them!".

