Search This Blog

Saturday, January 16, 2016

A Taylor buy day in the 30 yr Bond Futures

There has been a lot of volatility this past week, so I thought that I would show an example of a classic Taylor buy day in the 30 year bond futures. A TTT buy day follows a shorting day, taking out the low of the short day, then reversing into a trending up day.

It is important to pay attention to the short term trend, and try and trade in its direction. In this case the slow line of the 3-10 oscillator is above zero, and is of positive slope- both indicating a short term uptrend. Price is also above the 20 day ema, the only moving average that I use. Note the daily chart below-


Please also note below, the 15 minute chart of those two days. Several things are going on here-

1. The Jan 11 low of 155-11 is taken out around 3:45 am.

2. Although price reverses above that level at 6:00 am, that was too early for me. We got a second chance at 7:30. This bar was also a short term trendline break.

3. There is a 15 min divergence- price is sloping down, but the fast line of the 3-10 makes a higher low.

Price continued to move up all day, hitting the Dec 11 high of 157-17, a nice point to have a profit taking stop in place. Price moved up a little more after that, but if you cannot watch the market all day, you have to consider profit targets.


Saturday, August 8, 2015

Divergences

It sure has been along time since my last post. I really lost interest in posting for a while, but think that it would be worthwhile to continue to post and record my experiences in trading. I have been working a bit on my trading psychology, but I'll get into that more in future posts.

Today, I want to post a little about divergences. One of Linda Raschke's trading patterns is a 10 day divergence, referencing price levels against the highs and lows of the 3-10 oscillator. She discusses this more in her presentation of 5 Trading Patterns, and it has become the only indicator that I use. I also use a moving average- a 20 bar EMA, but that's all. Linda's trade is based on a 10 day divergence- 10 days from price low to price low. Sometimes it is 9, or maybe 11-12 days, but pretty much around 10 days. This is also a very similar to her turtle soup pattern, written about in Street Smarts.

Trader Vic Sperandeo discusses what he refers to as a 2b pattern, this is not always 10 days- it can be less or greater, and does not use an oscillator. Read more in "Trader Vic" for this pattern. It is good for picking up short term trend direction changes, and is a pattern that I will be using more.

Refer to the below chart of November soybeans, and look at the arrows on both the price chart, and 3-10 oscillator.


You will see that for the 1st, 2nd, and 4th set of prices, the price bars make new lows, but the blue line of the oscillator (sometimes referred to as the fast line) makes higher lows. Hence, the divergence. For the 3rd set of prices, the price bars make new highs, but the fast line is making a lower low.

Sometimes there is a small reward, and sometimes big. It will be interesting to see where this most recent trade goes, as Friday's price bar is hitting the 20 day EMA.

Saturday, September 8, 2012

Trading Breakouts

I wanted to post a bit on trading breakouts. In particular, I want to provide my thoughts on what happens the day after a breakout. Keep in mind that I am writing in reference to the Taylor Trading Technique, and Linda Raschke's writings (especially Street Smarts). According to Raschke, in an appendix of my copy of The Taylor Trading Technique by Trader's Press, she says that Taylor says to skip the first buy day, when price is breaking down from a congestion area. I am also looking at this when price is breaking up, as well. I have not yet found this in Taylor's writing, but let's assume that he did state this.

In one of her articles, Raschke mentions that she skips the first buy or sell swing at the start of a trend, often caused by- an NR7 bar (usually preceding a breakout), 3 small range days (consolidation), the point of a wedge (also consolidation), a breakaway gap, or a rising ADX. The point here is that a move out of congestion or consolidation is often the start of a new trend, or a continuation of a trend, with the consolidation portion being a pause in the trend. This can be seen on a bar by bar basis, as often after a strong breakout bar, there is a consolidation bar, many times a narrow range day, or chop that forms a doji bar. On an intra-day chart, this shows as consolidation.

Below are some charts that show this, starting with Friday's E mini future.


A consolidation can be clearly seen as a descending triangle, with support at the 20 day ema. Friday showed a big breakout, closing at the highs of the day. I got tricked into looking for a SS day after the breakout, but neglected to view things within the larger context of the uptrend, and fact that the b/o day was likely the resumption of that trend out of consolidation.

For a couple of more examples, see the below chart of Crude oil-


Notice the first congestion area. looking like a small box. The breakout bar clears the 20 day ema, possibly signaling the upturn of trend. the bar following tests the ma, but regains it- not a good SS day, but rather, a pause before the next up bar. The price trend then consolidates into a descending triangle at the ema, then moves out of it on high volume. the bar after the b/o bar is a z day, you would not be wise to short it.

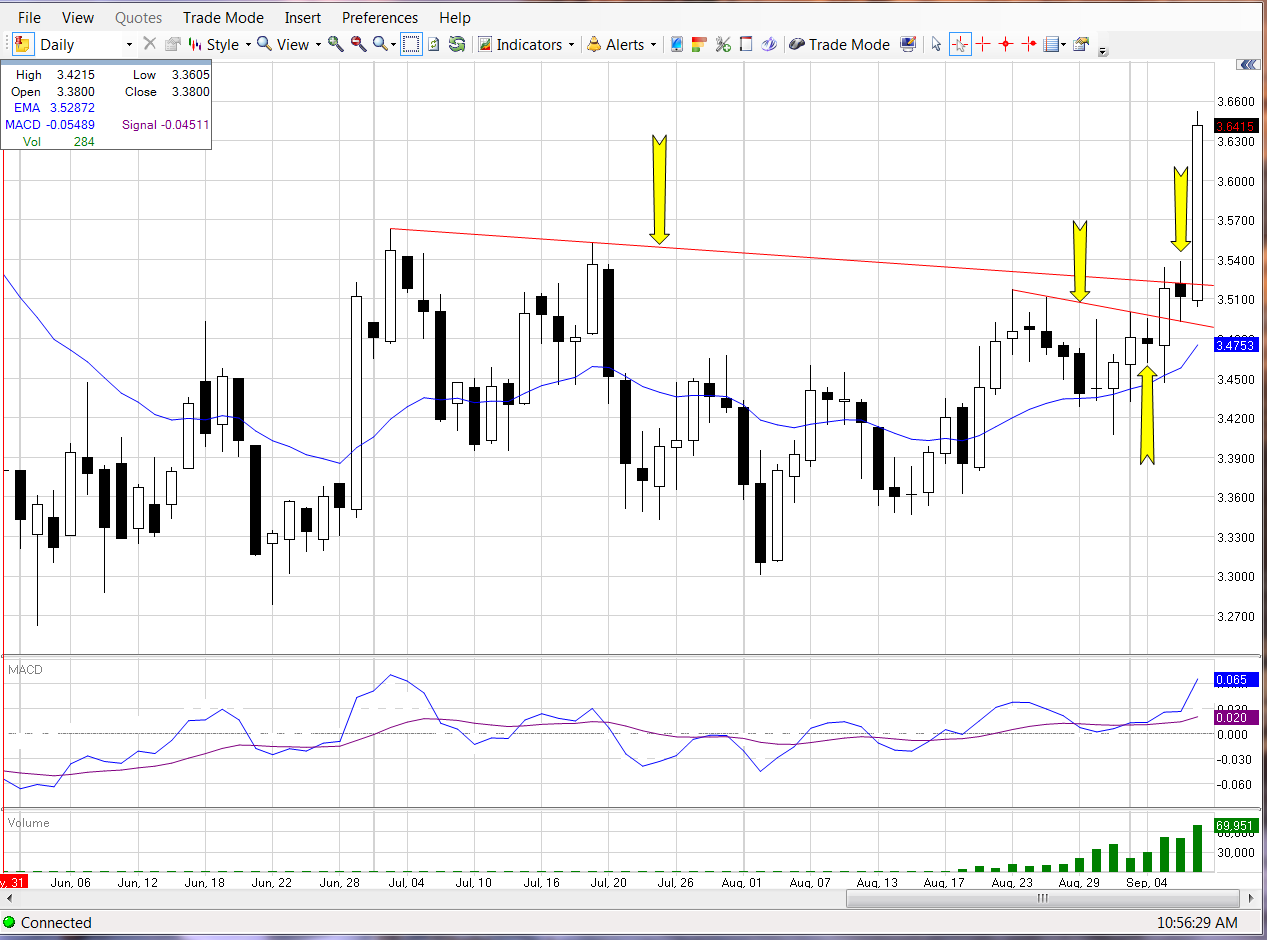
Here is a recent example of Copper-


The first breakout moves out of a small triangle that is within a larger pattern. The upper trend line serves as good point for setting a profit target. Note that price broke out following a narrow range doji bar, then formed another consolidation bar just below the upper trend line (just like the bar preceding the first b/o). This first move is part of a First Cross pattern that Raschke writes about often. It is often the second wave of a three wave a-b-c trend move.

Friday brought another breakout, due to the China announcement of more easing. Thursday's day after the b/o could have been traded as a SS day, but the lesson here is to trade the post b/o days carefully, especially if they seem to be indicating a change of trend.

Finally, take a look at the multiple breakouts in this chart of gold futures. See the small and larger triangle breakouts, and note that the b/o bar has increased volume compared to the day before. The third b/o is from a small bull flag, a consolidation pattern. The last b/o is very interesting. Thursday, price broke out of a pattern of three small range days (mentioned above), but closed weakly. It did close above Tuesday's high, and the sell off Friday morning may have well sucked in a lot of shorts before reversing. The lesson is to be careful shorting right after a breakout from consolidation.


Use this tendency to stay safe, and perhaps use as a criteria for holding onto a b/o bar for more than just the one day. All of that said, there does seem to be good reason to short after a breakout, when the trend is NOT changing, but I will post regarding that, at another time.

Sunday, July 1, 2012

A classic TTT sell short trade

I wanted to show you what a more typical sell short day looks like. Earlier, I discussed short selling a buy day high made first, but below is a classical Taylor sell short day. As you can see below on the daily chart of the October sugar futures, the sell day high was taken out on the sell short day, then price reversed.


Below is 15 minute chart, that shows the sell day high, the entry bar for the short sale breaking the sell day high and 20 bar ema, as well as a trend line break, which further confirms the trend change.


What you can also see, is the wide range sell off bar at 9:30 that is a great indication to cover the short, and take profits, when this many traders are selling, it's a great idea to cover the short position. As Linda Raschke said- "when the ducks quack, feed them!".

Saturday, June 30, 2012

When to be careful on a buy day

On Wednesday, I put on a buy day long position on the August gold futures (GC), and was stopped out of the trade. While this happens now and then, in retrospect, there was good reason to have been extra careful, or to have avoided the trade altogether. The chart below shows the set up day- a buy day, a sell day, followed by a sell short day. This should have set up a Taylor buy day, where the sell short day low is taken out, then a reversal takes place.


For a buy day entry, I look for three things to take place-

1. A break of the previous day's low.
2. Price reversal above that previous low.
3. A break of the 20 bar exponential moving average on a 15 minute chart.

See the chart below, and you will see the horizontal red line that shows the previous day's low, a consolidation of price, and the break above the low, which also broke the 20 bar ema. Following the breakout, price fell, and I was stopped out, as the lower trend line was taken out. 


Here is the daily chart that show how the day ended up- lots of chop back and forth, with no real directional movement-


So what is to be learned from this? I asked Scott Hoffman (my broker and a great Taylor Trading educator) what he thought, and why he noted the buy day of GC as "careful" in his Swing Trader Insight service (worth looking into if you want to trade the TTT method). His comment was that the setup day was an inside day, in addition to having been a shorting day. This indicates that a breakout may be coming, as it was not a true sell short day. A better trade would have been to go long if the previous day had been a proper sell short day.


Sunday, June 24, 2012

Selling short on a buy day

This past Friday, sugar futures presented a perfect example of a shorting opportunity on a Taylor buy day. The second chart below is the daily bar chart for the October contract for SB. Monday set up a breakout- a doji bar just below the 20 day ema. The breakout did occur on Tuesday, with Wednesday carrying further momentum, often a sell short day after a breakout.

On Thursday, we see a classic Taylor sell short day bar. The previous high was taken out, then price reversed through that high, giving a signal to short. You will see in the chart directly below, that the horizontal red line indicates the previous high, with it being taken out at 10:00 am. Price tested the morning high, then broke down again at 11:30 am (see the yellow arrow). I use the 20 bar ema on a 15 minute chart to help validate the trend reversal, so the 11:30 bar is my entry signal.


This shorting day sets up the Taylor buy day. The bias coming into Friday would be to look for a violation of the Thursday low, then a reversal into an uptrend for the day. Instead, price opened above the Thursday low, dipped a little, then climbed before falling. How can this be traded? I have found that the 50% fib retracement is a good indication of whether or a not a trend will continue, or fail. Other classic fib levels can be used, but even going back to Charles Dow, and then taught well in Victor Sperandeo's book Trader Vic, the 50% level is pretty reliable, and can be used an trend entry level if you are not able to catch a buy day or sell short day entry earlier. For more on this, follow Scott Hoffman's blog (click on his name under "trading links"), or go to Richard Russell's site, Dow Theory Letters.

As you will note in the below chart (15 minute bars), the 50% retracement principle comes into play clearly. I have drawn fib level lines, from Thursday's high (double top), down to the low just after the open on Friday. The high on Friday tested, then failed at, the 50% fib level (see the horizontal blue line). Again, I use the 20 bar ema on the chart as a trend reversal validation tool, so the short signal for me came at 9:00 am, with the wide range bar at 10:45 indicating that the position should be closed out. A bar like this is often a sign of an exhaustion move.


So, while the day after a sell short day of often a buy day, if the previous day's low is not taken out, but price climbs, this may be indicative of continued selling pressure, and a "buy day, high made first" setup may present itself as an opportunity to short.

Friday, February 3, 2012

Whipsawed in a trade

I want to provide an example of a trade that was a losing trade, even though all of the trader actions were correct. More importantly, we need to look at the mental states involved, and what could have happened. This morning, there was a breakout setup in soybean futures. Being able to be at the screens at the open (9:30 am CT), I went long as soon as price went above the last high (the overnight session), and had my stop in place. Price then reversed against my position. Here is where new traders can freeze, thinking that the trade will come back and go their way. If a b/o reverses, you have to get out.

Fortunately, I closed the long position, and went short. Experience has shown that a failed breakout can yield a good trade as price goes against the trapped longs. In this case, price reversed again, and went well above my short entry. At that point, I had no business being in the trade, and covered the short.


As you can see above, the 5 minute bar at the open created a crazy candle. The lesson here is- this stuff happens, and the key is that as long as you know that you trade a system that has a positive expectancy, you have to take all signals, both long and short. There will be losing trades now and then, but we are trading on probabilities, not absolutes.